
Charts in the wild!
A short and sweet reflection on impactful data visualizations I encountered organically this week.

On Monday, The Washington Post published the latest update to their ongoing analysis of individuals shot and killed by on-duty police. (The data is available on Github.) They employed a variable-width bar chart — also known as a barmekko chart — very effectively to show the disproportionately large number of Black people killed by police relative to the population of Black people — and everyone els e— in America. In the chart below, the height of the bar represents the number of people killed by police and the width of the bar represents the size of the population for each group in the analysis.

This marimekko chart variation is one of my favorite chart types for visualizing two quantitative variables and several categories. Flowing Data provides several other excellent examples of this chart type and some tutorials for making it in R and Excel. Nathan Yau, Flowing Data’s creator, had a fascinating conversation with Alberto Cairo and Simon Rogers on the Data Journalism Podcast just a few weeks ago. Did you know Yau started Flowing Data as a grad school project?
In this line chart published in their November 30th newsletter, Chartr visualized LinkedIn’s data comparing the number of remote jobs available and the number of job applications for remote roles. The shading between the lines reinforces the chart’s message — most workers don’t want to go back to the office.
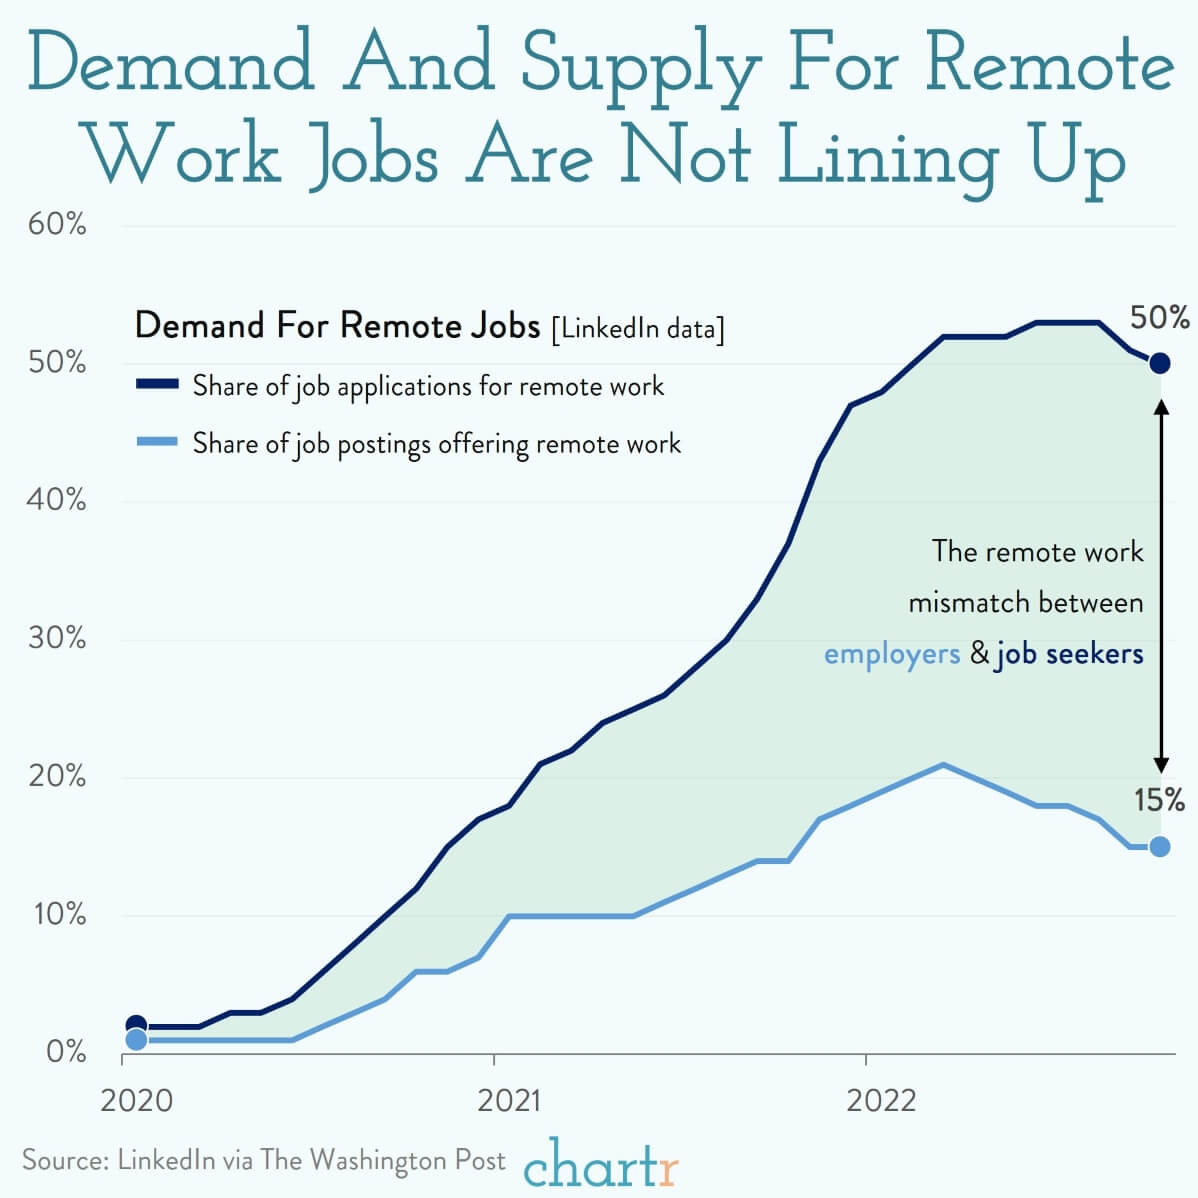
My recent experience with recruiters who have reached out to me reflects this, too — they are desperately looking for experienced data analysts willing to work in hybrid or office-based roles. As for me, I’ll never work in an office again.
Happy Saturday, folks! I have a new Meet the DataFam in queue for Monday, so subscribe to my Medium posts or watch my Twitter or Mastodon (@nicolemark@vis.social) feeds.