


Give and Take: The Art of Constructive Data Visualization Feedback, Part 1
Part 1 focuses on asking for and receiving feedback on your data visualizations. Part 2 will cover giving feedback.

This is the first of two posts about giving constructive data visualization feedback and graciously receiving it. It’s based in part on a Conversations with Women in Dataviz event which you can watch here.
AI disclosure: I used NapkinAI to create the two images in this post.
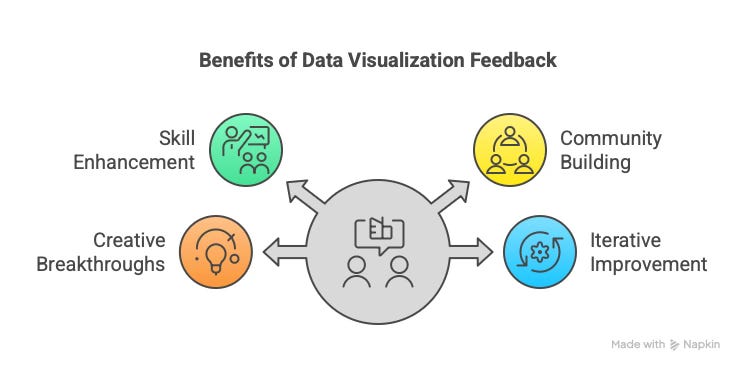
Data visualization is a powerful tool, a blend of science and art that allows us to communicate complex information effectively. Whether you're a seasoned expert or just starting your journey, the path to creating impactful data visualizations is paved with learning, practice, and crucially, feedback. Engaging in the feedback process – both giving and receiving – is one of the most valuable ways to accelerate your growth. Benefits include:
Learning new skills and techniques from practitioners with different skillsets
Building professional relationships and contributing to a vibrant community
Breaking through creative blocks by testing out suggestions you receive
Talking through your ideas to help you iterate on your storytelling, analysis, and design
This process is for everyone, regardless of experience level or role. Asking for feedback can be intimidating, especially if you're new to the community of practitioners or have anxiety about potential criticism. However, it's a critical step for growth and may become an invaluable part of your process.
Who should ask for feedback?
Anyone can–and should!—ask for feedback, regardless of experience level. There is always opportunity for improvement at every stage of your career. Even experienced practitioners who have been working with data visualization for many years still have room for growth.
Be specific in your request
To make the feedback process as valuable as possible, be specific about what you're asking for. A general request like, "Can you give me some feedback on this viz?" is less helpful than specifying the areas you'd like input on. Are you looking for a quick review, or an in-depth critique? Are you looking for feedback on the design, your analytical choices, or storytelling? Knowing what kind of feedback you want and communicating it helps the giver provide relevant input.
How to reach out to other practitioners
Leverage community resources designed for feedback. Some options include:
Attend Viz Office Hours with Tableau Visionaries Michelle Frayman and Nicole Klassen. This initiative is conversational in nature and tool agnostic.
Engage in community projects like Tidy Tuesday or Back 2 Viz Basics.
Join community groups like Women in Dataviz or Data Careers Summit.
Consider the Data Visualization Society’s mentorship program if you’re seeking one-on-one feedback with the same individual over time.
Send a message to a community member you respect.
Overcoming the fear of asking is key. Remember that often, the person you're asking is happy to help. Asking for help, even if uncomfortable at first, gets easier with practice. It can feel rewarding for the person giving feedback as well, as it allows them to think through problems and practice their own skills.
Incorporating feedback
Receiving feedback is only half of the process; the other half is actively engaging with it and deciding how to incorporate it into your work (or not).
Be open-minded. Remember the reason you asked for the feedback in the first place, and give consideration to each critique. If you received feedback from more than one person, review the recommendations with the goal of identifying common themes. Revise your work based on the insights that resonate with you, and leave the rest.
If others are receiving feedback during the same session, notice the suggestions they receive. Hearing feedback from experienced practitioners can be an incredible learning opportunity.
Remember, once you've received feedback, the decision of what to do with it rests squarely with you. There is one significant exception: if the feedback points out an ethical issue or a misleading chart, you should absolutely implement a fix. This includes using the wrong metric or misrepresenting the data–which may have happened accidentally! When dealing with sensitive data, being open to feedback on how to handle it respectfully and empathetically is crucial.

Remember to thank the reviewer for their feedback, even if you don't use it all. Their time is valuable and they are rooting for you to succeed.
Document your progress
Keep each version of your work. This allows you to look back and see how much you've improved over time, which is a direct reflection of the feedback you've received and the work you've put in. Revising a viz based on feedback might lead to some improvement, but often, dramatic growth comes from consistent practice and receiving feedback over time.
Next week, we’ll talk about how to give feedback in a kind and empathetic way.