
Meet the DataFam: John Whitmer
Learn more about Boston Tableau User Group co-lead, Florida native, and scatterplot enthusiast John Whitmer.

👋🏼 Welcome back to another installment of Meet the Datafam! John Whitmer is my guest this week. ICYMI, check out previous editions with Brittany Rosenau and Elisa Davis.
The Format
I’ve chosen the following structure for Meet the DataFam.
1️⃣ The Background. The backstory regarding my interactions with my guest. Seems like there’s always a fun little anecdote to share.
2️⃣ The Viz. I pick my favorite of each guest’s public data visualizations on Tableau Public (or other portfolio or website).
3️⃣ The Questions. I’ll pose the same questions to each guest (in writing) and publish their answers exactly as written, editing as lightly as I possibly can considering I majored in English as an undergrad. I’ll clarify dataviz jargon and Tableau-specific terms and link to relevant websites where appropriate. I intend for anyone to be able to read this post and understand and enjoy it. If there’s a term you don’t understand, PLEASE, comment here, DM me on Twitter, or email me at hello@nicoledesignsdata.com. I will edit the post and make sure future posts contain clarification.
I can’t refrain from commentary, so when I chime in, the text is italicized. The first time, it’s labeled “Nicole’s note” and subsequently “NN”.
The Background
Shortly after I followed John on Twitter, I learned two things of special interest to me–one, he’s from Florida, and I am always down to commiserate with anyone who understands this weird, wonderful, dreamy hellscape that I claim to want to leave, but here I am. Still. Secondly, John’s taste in television and film is superb. When he’d post commentary about shows or movies that I’d already seen, it affirmed my trust in the efficacy of his recommendations. (And it’s not lost on me that I have also implied that MY taste in television and film is superb. Let me just make it explicit, then: IT IS.) I watched Severance (Apple TV), by far my favorite show of the year, on John’s Twitter recommendation. Perhaps of more interest and impact to you, dear Datafam, is the fact that John introduced me to another John–John McKenzie, a fellow Tampa resident and Tableau professional. Together we relaunched the long-dormant Tampa Tableau User Group! We make great co-leads and share lots of data-related interests in common. And now I have yet another person to discuss the state of the state of Florida with!
The Viz: Waffle Much?
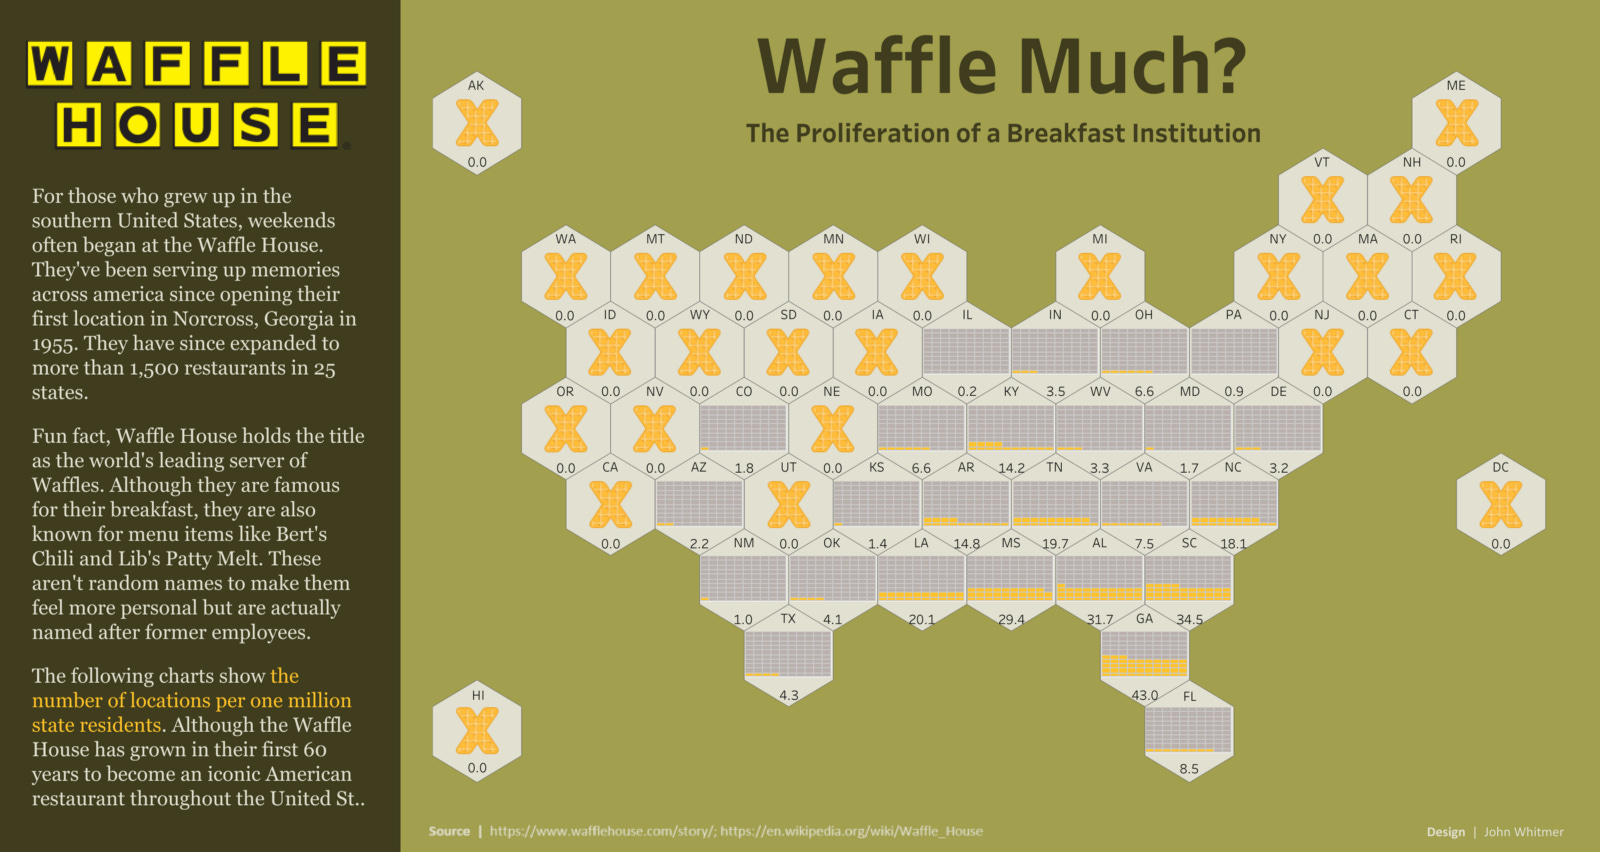
As a breakfast and brunch enthusiast, a superfan of all things meta (as in metadata, not as in metaverse), and FUN data visualizations, I 💛 love 💛 this hexmap of waffle charts indicating the number of Waffle Houses per million residents by state. (Georgia, with 43, wins the number one spot by this metric handily.)
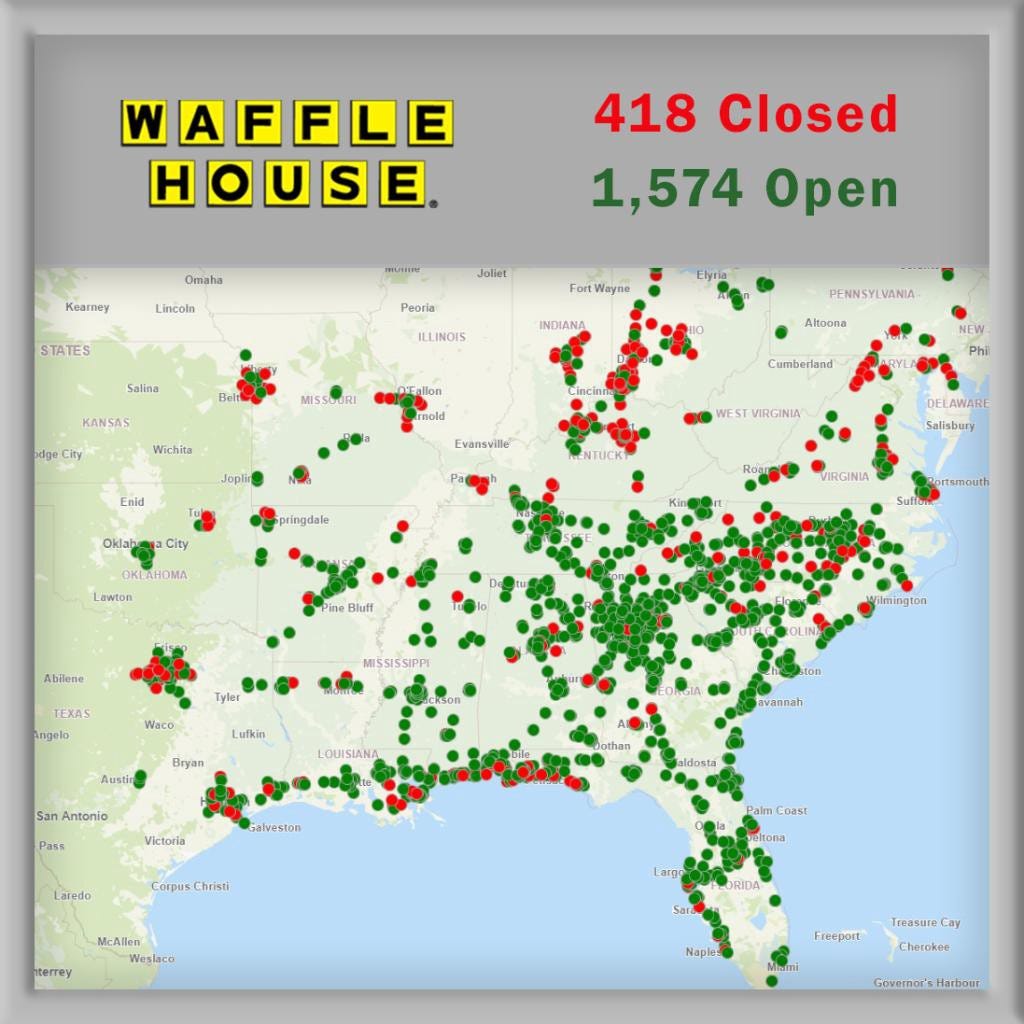
The viz has a Florida connection, too, other than our pathetic 8.5 Waffle Houses per million people: the Waffle House Index! During Hurricane Ian in late September of this year, I stayed here in Tampa and nearly created a viz about this unofficial — but historically pretty accurate — measure of the severity of a hurricane or other natural disaster by the number of Waffle Houses that are closed. Then my power went out. By the time it returned, my ADHD had flitted off to other topics.
How the famous "Waffle House Index" began
The Director of PR and External Affairs for Waffle House, Pat Warner, explains the origins of the "Waffle House Index."www.accuweather.com
🙋🏼♀️The Questions
Where are you from originally?
I grew up not too far from you, in the St. Petersburg area of Florida. I lived in Pinellas Park until I was in high school, then spent a few years in Clearwater and downtown St. Petersburg. It was a fun place to grow up.
Nicole’s note: Fun fact–My first Tampa residency (residence-hood? resident-ness?) was from about 1999 to 2001 and my favorite t-shirt was a Pinellas Park Middle School baseball tee I got at a thrift store on S. Dale Mabry Hwy in South Tampa.
Where do you live now?
As much as I liked St. Pete as a kid, I really did not like it as an adult. Unless you worked in hospitality, the job market was a major challenge in the 2000s. (Can confirm.) It was already getting way too hot and hurricanes were getting more frequent. Plus, we had just had our first kid and the childcare and education options in that area were… lacking. So I decided it was time to get my MBA. After getting waitlisted at Carnegie Mellon and Duke, I decided not to roll the dice and instead take early admission to Boston University. I’m glad I did, because BU was a great experience and led to me having awesome jobs at Teradyne and Staples (where I work now) and allowed me to live in awesome towns like Newton and Maynard (where I live now).
NN: As a previous North Carolinian–I spent eleven years in Chapel Hill, Durham, and Asheville– I am bound by duty and friendship to say that 🤮Duke sucks. Go Heels!
Where would you live if you could live anywhere (assuming money, family, work location, etc., are not a concern)?
That’s easy, Villefranche in France. We went there on our honeymoon and did not want to leave. It’s this gorgeous, 14th century town in the hills of southern France with bakeries run by generations of families, but then only a short drive to the energy of Monaco. [15.9 kilometers, to be exact.] It might be the last perfect place on earth.

NN: Now I want to move to the French Riviera, too. Barcelona was my top pic prior to reading about Villefranche, but regardless, life in the United States is becoming less and less appealing.
Do you have any pets? What kind(s)? What are their name(s)?
One, my dog Zoe. She’s an American Staffordshire Terrier. We got her right when the COVID lockdowns began. If it wasn’t for that, I probably would never have been able to give a puppy the attention that they need. We hadn’t had a dog since our Boxer died about 10 years before and I had very much gotten used to not having a pup so I was very hesitant, but I had no idea how much I needed her. She really needed me too; we have an amazing relationship.

NN: Dogs are the best. My youngest–-Oakley (we call him “Potato”) — is an AmStaff mix. They are the sweetest, most loyal breed I’ve met.
Did you start your career in a data-related role or in another field? If another field, which one?
I’ve always been involved in data. I started out of college as an analyst valuing mortgage-backed securities for a sister company of Citi. That was in the late 2000s when the housing market was a huge dumpster fire, so that was interesting. Then I worked as an analyst for a hedge fund in NY and worked in credit risk for Bank of America around 2008–2010 when the banking system was imploding. Again, interesting, and starting to feel like I’m bad luck. Luckily after that I found some stability and sanity at Teradyne and again at Staples, but still 100% data-related.
If you had to choose a different career path, what would it be? Why?
I grew up obsessed with movies. I very much wanted to be a screenwriter. I started a number of scripts but didn’t have the discipline to finish one (and wouldn’t have known what to do with it if I had). I think I had two favorites. One was a comedy about a guy who robs a convenience store when it first opens but discovers they had emptied the cash register the night before, so he decides to hold the clerk hostage and work the register all day to make his money (that he of course needs for a good reason). It doesn’t sound funny but it was, much high jinx ensue (Spelled this way, it’s indeed two words. Hijinks is also an acceptable spelling.) The other was NOT funny; it was a drama about a man and woman who start a relationship after meeting at a support group for people who murdered their spouses. Great character study opportunity.
NN: I would totally watch both of those films. And now John’s amazing taste in movies and tv makes total sense.
What is your favorite Quick Table Calculation and why?
I suppose Percent of Total. I use it all the time, and it’s so easy to build the view as a normal sum then switch it to Percent of Total and feel confident that the calcs are correct.
What do you find the most challenging about Tableau?
UX [user experience]. Tableau makes it excruciatingly difficult to make dashboards look beautiful. It truly and deeply bothers me how they ignore enabling very basic design features in favor of AI-centric features [Augmented Analyticsproducts Ask Data and Explain Data are examples] that I would be shocked if more than 5% of customers actually use.
NN: When Elisa Davis was my guest, she gave a similar answer. Brittany Rosenau’s answer was also related to UX. And if I were my own guest, guess what my answer would be! Tableau, I think we might be on to something here!
What do you like most about Tableau?
It makes it amazingly simple to visually explore data and quickly crank out a few charts to support a hypothesis.
If you couldn’t use Tableau, how would you do data visualization? (e.g., coding language, other BI tool, draw it on paper or digitally, wouldn’t do it at all, etc.)
Hopefully I would have moved on from Excel by now, so I guess Power BI. Other than some basic SQL, I am not a coder.
What is your favorite chart type? Why?
I dig a good scatterplot. Not a lot of chart types make it easy to analyze three or more related measures at once. Plenty can do that, but not as easily or clearly as a scatterplot.
NN: Solid choice. Definitely in my top 3.
Which community challenges do you regularly participate in? Why would you recommend them to new members of the Datafam?
I actually don’t participate in any of them anymore. Not because I couldn’t benefit from them (far from it), but that just isn’t how I choose to spend my free time these days. The pandemic taught me just how much my family needs me and how precious those moments are. If they want my attention, you will never ever catch me saying, “Not now kid, I’m drawing charts.” Life is way too short.
Have you received any certifications, honors, or accolades you’d like to share or feel especially proud of? (e.g., Viz of the Day, Tableau Certified in some area, or something non-data-related like black belt in jiu jitsu.)
The thing I’m most proud of is being a co-lead of the Boston TUG [Tableau User Group]. I love seeing others develop and meeting new and interesting people in the community, so this space is perfect for me.
How can people learn more about your work? (e.g., portfolio or website URL, social media handles, etc.)
I have a very modest portfolio on Tableau Public (see how I prefer to spend my free time). Besides that, if you want to learn about my work I guess you’ll just have to come work with me at Staples (I am hiring!).
🆕❓What are your astrological signs? (I would love to know your sun, moon, and rising signs, but if you know only one, the one you know is your sun sign. What is that?)
I don’t know about sun and moon and all that business, but my sign is Cancer and its description is unbelievably accurate.
Cancer is John’s sun sign, and I am grateful he was down to answer my new, possibly ridiculous, question.